

A Google Analytics Walk Through
Google Analytics often seems too difficult, but it doesn’t have to be if you know exactly where to click.
In this post, I am going to take you on a Google Analytics walk-through to show you how to easily track user behavior [Call-To-Actions and Click-Through-Rates] to determine how to improve your website.
Most small businesses never do this.
They simply install Google Analytics and then do little else. They will then occasionally visit their Google Analytics page and look at the total amount of traffic their website is getting.
Why do people not dig deeper with Google Analytics? Because it’s seem so dispiritingly complicated.
Well, not so today.
Today, I need to analyze a particular page on our website and I am going to show you exactly how I do it.
I am going to take you on a Google Analytics walk-through showing you how to easily track user behavior.
And, on this tour, we are not going to use any programming or fancy metrics.
We are going to use the basic tools provided by Google Analytics which, when we know exactly where to click, show us invaluable information to improve our website.
Are you ready to find out these awesome, secret Google Analytics tricks to analyze your web content?
Let’s get started.
Step 1: Determine What You Want To Analyze in Google Analytics
Today, I will be evaluating our Free Domain Analysis page, which provides a tool that, through question and answer format, evaluates whether your domain is ready for success.
Here is quick look at the page as it stands now (I may be changing it after this evaluation).

The page does very well in the search engines, currently placing #2 for the term free domain analysis.
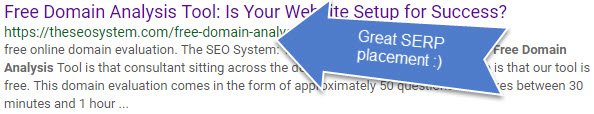
The page also ranks extremely high for the term domain analysis tool and has a great CTR of 21.2%, far higher than the average CTR of this position based on Brian Dean’s latest CTR study.

However, the page is not getting the amount of signups that I would like and we are going to use Google Analytics to find out why.
So let’s first see how much traffic the page is getting.
Step 2: Determining the Amount of Traffic a Page is Getting
We can’t know how many signups we should anticipate if we don’t know the existing traffic to the page. So, let’s have a look at the amount of traffic generated.
To do this, we go to Google Analytics | Behavior | Site Content | All Pages as you see below:
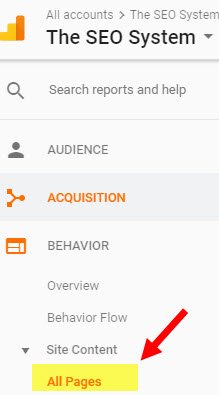
Now, over on the right, you will see all the pages on your website. By default, you will see just the top 10 pages. However, use the “Show rows” feature to show as many pages as you would like.
Now, you want to locate the page that you are looking for.
For my analysis, I see that the page had 102 Pageviews, 95 Unique Pageviews and that people spent an average of more than 5 minutes on the page.
![]()
I will also usually do a quick check in the Google Search Console which quickly shows me how many organic visitors a page had. (This info is also available in Analytics but is slightly more complicated to get to.)
Here are the Google Search Console results:
![]()
I now know that of the 102 visitors nearly all of them come from organic traffic.
What does this tell me? Nearly all my visitors to this page come from Google? Can you draw any conclusions?
It tells me that I can do a better job of inviting current visitors of other content on The SEO System to my free domain analysis page.
Now comes an even better part.
A Google Analytics tab that you are probably not using but gives you a wealth of information!
Are you ready?
Step 3: Where Do Visitors Go After They Visit Your Landing Page
Many people think of a landing page as a particular form that you are directing people to or a special ad page that you have designed for an ad campaign.
However, in the end, it’s where people “land” on your website.
In this case, our landing page is the free domain analysis page.
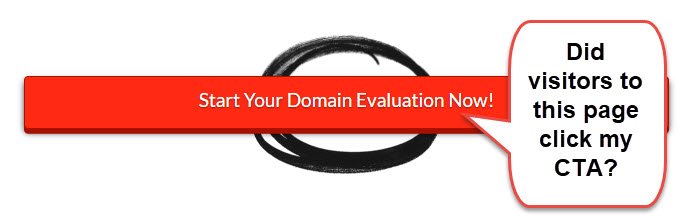
And, when visitors arrive there, I want them to take a particular action. I want them to click the button that allows them to start the domain evaluation.
I want them to click on my CTA (Call-To-Action).
And, in this case, it’s not happening as much as I think it should.
Now, while Google Analytics has the ability to track goals and conversions, this is the thing that can get downright daunting for many Google Analytics newbies.
So, what do you really want to know about your web visitor? How can you track a CTA in Google Analytics without setting up complicated measurements?
For most of us, the answer is simple.
You want to know what they did after they visited your landing page.
What page did they go to next?
And this is easy to do in Google Analytics if you know where to go.
First, still within the “All Pages” window, click the link within Google Analytics.
![]()
In the next window, click Navigation Summary.

This Google Analytics window is awesome, providing you with a wealth of information about your web content and means to improve it.
Why?
It tells me exactly what people did after they visited the page. It tells me if they clicked the CTA on the landing page.
And this is easy to track. Much easier than you would think.
After clicking the Navigation Summary button, you see the “Next Page Path” column near the bottom right.
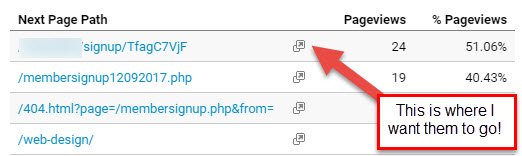
This is where people went after they visited your landing page. It represents the success (and or failure) of your Call-To-Action.
In my situation, I see that out of roughly 100 visitors, 24 clicked on my CTA. That’s a 24% CTR (Click-Through-Rate).
Is that good?
Well, according to WordStream, the average CTR for Google Ads is about 2% and in the article What’s A Good Call-To-Action Click-Through Rate?, data suggests that “the average CTR for a call-to-action button is 3.29 percent across all industries.”
So, I’m at 24%. Is that good?
It’s frickin’ awesome!
And, as you see in my “Next Page Path” results, 19 people clicked the Member Signup Link on the right sidebar, which is another CTA on that page.
This means that, out of 100 people, I have 43 people (24+19) clicking my CTAs. A 43% CTR? I’ll take that any day.
However, it all also tells me that visitors may be confusing the right sidebar Member Signup CTA with the domain evaluation. And, this could lead to a dissatisfied visitor, which I don’t want.
To remedy this, I could remove the sidebar from the free domain analysis page and make this a full page, which is often the recommended tactic for landing pages.
Additionally, I could make the CTA on the page above the fold, which it is currently not. Because many experts will tell you that you always want the CTA above the fold.
But I do have a HUGE Click-Through-Rate so I don’t want to mess with that too much.
I’ll let you know in the future if I make it any changes and if that results in improved CTRs.
But, for now, let’s do a quick review of our walkthrough!
Conclusion: Easily Tracking User Behavior [CTAs & CTRs] in Google Analytics
I wrote this article for both of us, you and I.
I needed to do this evaluation and I thought it would help if I shared my methodologies with you.
Google Analytics can be daunting until you know where to click. And then, it’s BING-BAM-BOOM, and you’ve identified critical information that will improve your website.
In analyzing this page, we very quickly determined that:
- The page does great in the search engines and people spend over 5 minutes when they visit. All of this means that the page design and on-page SEO is terrific.
- I learned that nearly all of the visitors to this page come from the search engines, not from elsewhere on my site, which means that I could do a better job of promoting the page on-site.
- Currently, the link to this page is only in the footer. Perhaps, I’ll move it to a menu item?
- I learned that I have a great Click-Through-Rate (24%) on my on-page CTA and a 44% CTR for all CTAs on the page. Very positive.
- I also learned that I could probably improve the main CTA by removing the sidebar on this domain analysis landing page.
- With this very positive CTR, I know people are getting to the login form. So, what will be my next step? I now need do the same evaluation on the signup form to see if I’m losing any customers there, which I think I am because I do not currently (this is about to change) offer social media login.
All of this from just about 15 minutes in Google Analytics!
The bottom line is this: Google Analytics does not have to be the confusing enemy.
Once you know where to click (especially using the Navigation Summary page) you can be improving your site CTAs and CTRs in no time.

Richard Cummings
Latest posts by Richard Cummings (see all)
- Indexing Requests Currently Suspended [Google Search Console] - October 15, 2020
- Google Analytics and Google Tag Manager Code:Do I Need Both? - September 19, 2020
- WordPress X Theme:How To Setup Google Tag Manager - September 17, 2020
More Great Online Marketing Articles:
 Google Analytics and Google Tag Manager Code: Do I…
 5 Free Social Analytics Tools for Businesses
 WordPress X Theme: How To Setup Google Tag Manager
 Predictive Analysis & Your Business: A “Targeted” Lesson
 Free SEO Domain Analysis Tool: Is Your Website Setup…
") 5 Website Optimization Tips (that are non-negotiable!)
5 Website Optimization Tips (that are non-negotiable!) How to Use Fetch As Google in the New Google Search Console
 When and Why Google Should Fear Facebook: A…